Testing Touchstone with a simple For Loop
A minimal testing of touchstone by using a simple for loop
Introduction
I did a minimal testing of touchstone by using a simple for loop.
Therefore, I created a simple R package repository on GitHub called
TouchTest .
Inside the script.R file, there exists a function touchstone::benchmark_run which helps to benchmark any function call from the package.
To make it simple to test the minimal functionality of touchstone, I modified the function and wrote the for loop inside a random_test function.
Test
On the main branch, inside the script.R file, we basically loop from 1 to 10 printing the current number.
# benchmark a function call from your package (two calls per branch)
touchstone::benchmark_run(
  # expr_before_benchmark = source("dir/data.R"), #<-- TODO OTPIONAL setup before benchmark
  random_test = function() {
    print("Hello, world!")
    # Loop from 1 to 10
    for (i in 1:10) {
      print(i)
    }
  }, #<- TODO put the call you want to benchmark here
  n = 2
)
However, onn the devel branch, there is a minor change in the for loop.
We print from 1 to 100 instead.
# benchmark a function call from your package (two calls per branch)
touchstone::benchmark_run(
  # expr_before_benchmark = source("dir/data.R"), #<-- TODO OTPIONAL setup before benchmark
  random_test = function() {
    print("Hello, world!")
    # Loop from 1 to 100
    for (i in 1:100) {
      print(i)
    }
  }, #<- TODO put the call you want to benchmark here
  n = 2
)
Results
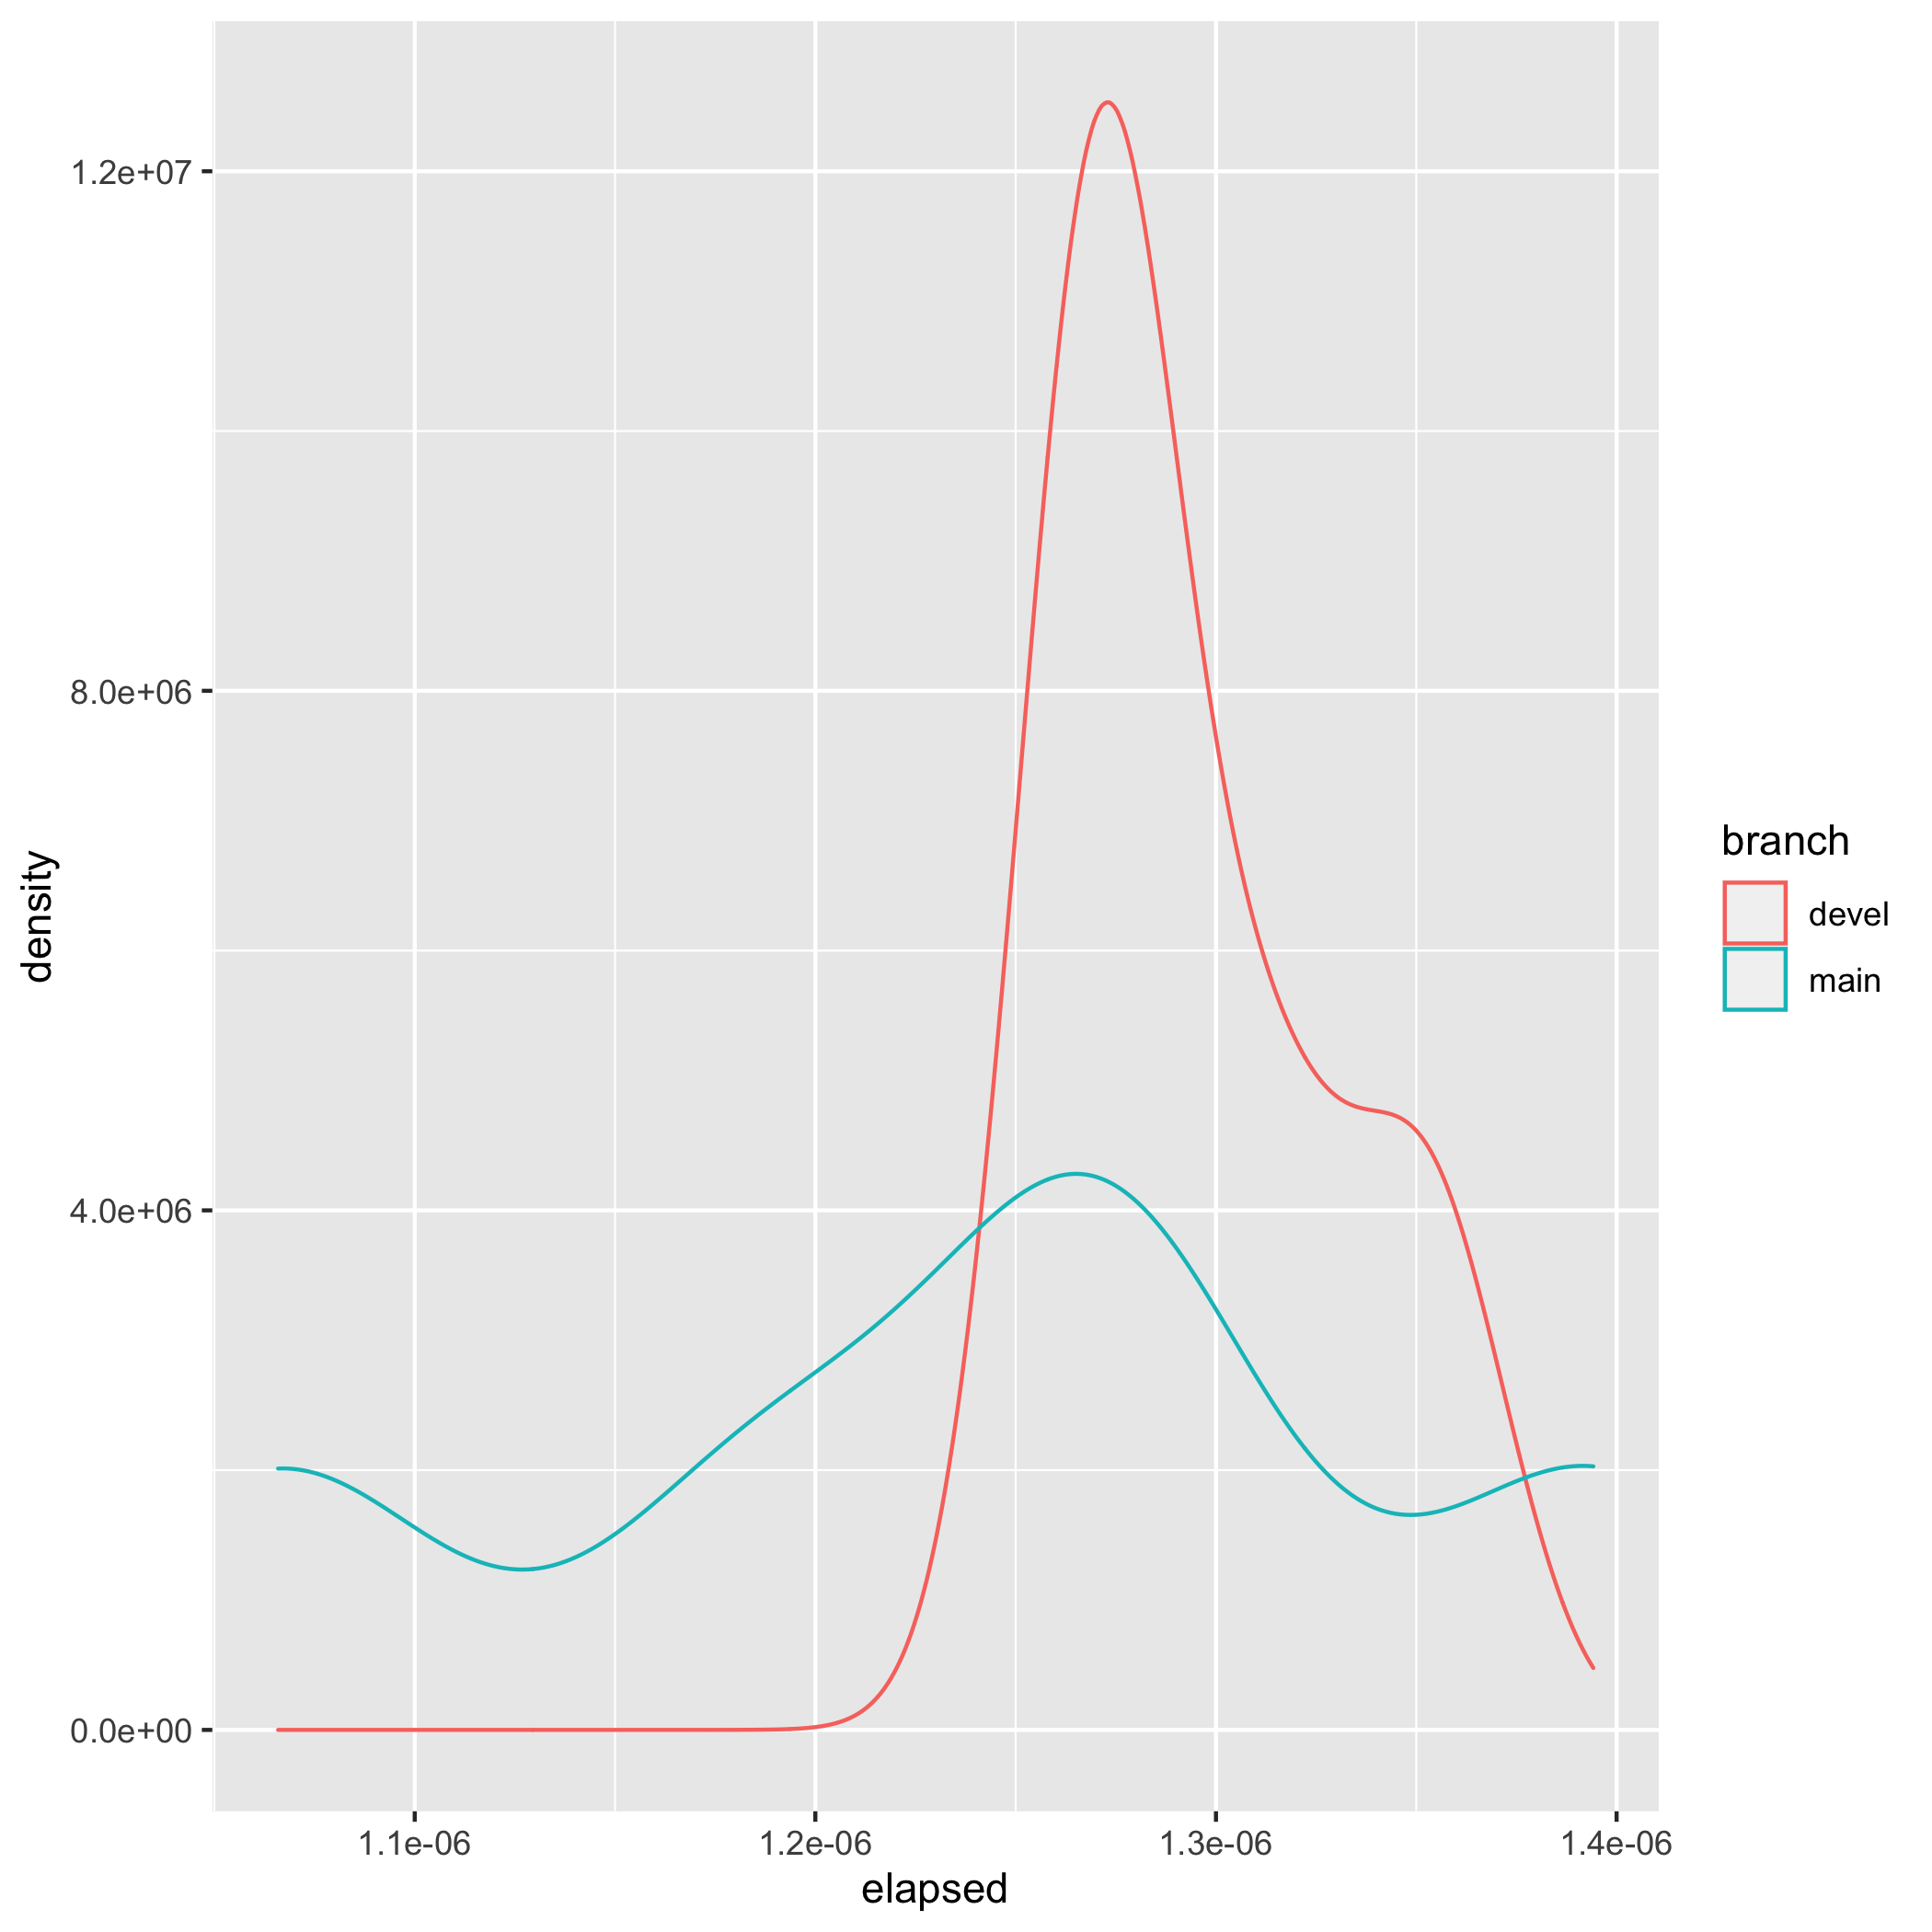
It is quite obvious that the 1 to 100 loop will take longer time than the 1 to 10 loop. Inside the touchstone directory, plots and pr-comment folders are created naturally containing the image of the plot and the PR comment text respectively. Below shows the results as expected.

The graph above demonstrates the visualizations of the distribution of the timings for both branches.
It can be inferred from the graph above that the density of the devel branch is greater than that of the main branch. This is due to the fact that the devel branch entails looping 100 times whereas the main branch entails looping just 10 times.
Benchmark result is posted as a comment in the Pull Request. An example is shown below :
This is how benchmark results would change (along with a 95% confidence interval in relative change) if b61b5addb59ac69eca91ee97caf7e5f5ef986aed is merged into main:
-
 random_test: 1.24µs -> 1.3µs [-5.9%, +15.17%]
Further explanation regarding interpretation and methodology can be found in the documentation.
The results can be interpreted as an increase in time by approximately 15.17% from the devel branch when compared to the main branch. To avoid any uncertainties, under the hood, the code is run n times based on the confidence interval. The confidence interval shows the certainties about any estimated differences. Hence, a 0.95 confidence interval tells that if the benchmarking experiment were to be repeated 100 times, the estimated change in speed would be in the interval 95 out of 100 times. The graph generally gets noisy when there is no significant speed change.
Therefore, merging a Pull Request of such nature will mean that the code will be a little bit slower. However, checking from the speed decrease implies that it will hardly be noticed practically. There is always a trade-off between time and functionality especially when a new feature is introduced in a code. This is the reason why the Confidence Interval is very crucial with regards to code benchmarking.
Conclusion
Even though, the touchstone package is an experimental R package, it aims on providing the means to perform accurate benchmarking tests for package developers. Due to the fact that Pull requests are natural units for measuring speed, connecting benchmarking to pull requests makes it easier and faster to use.